The Real Cost of Homeowners Insurance in Every State in 2026 — Who's Getting Crushed and Why
The Real Cost of Homeowners Insurance in Every State in 2026 — Who's Getting Crushed and Why
Published 2026-04-11 • Price-Quotes Research Lab Analysis
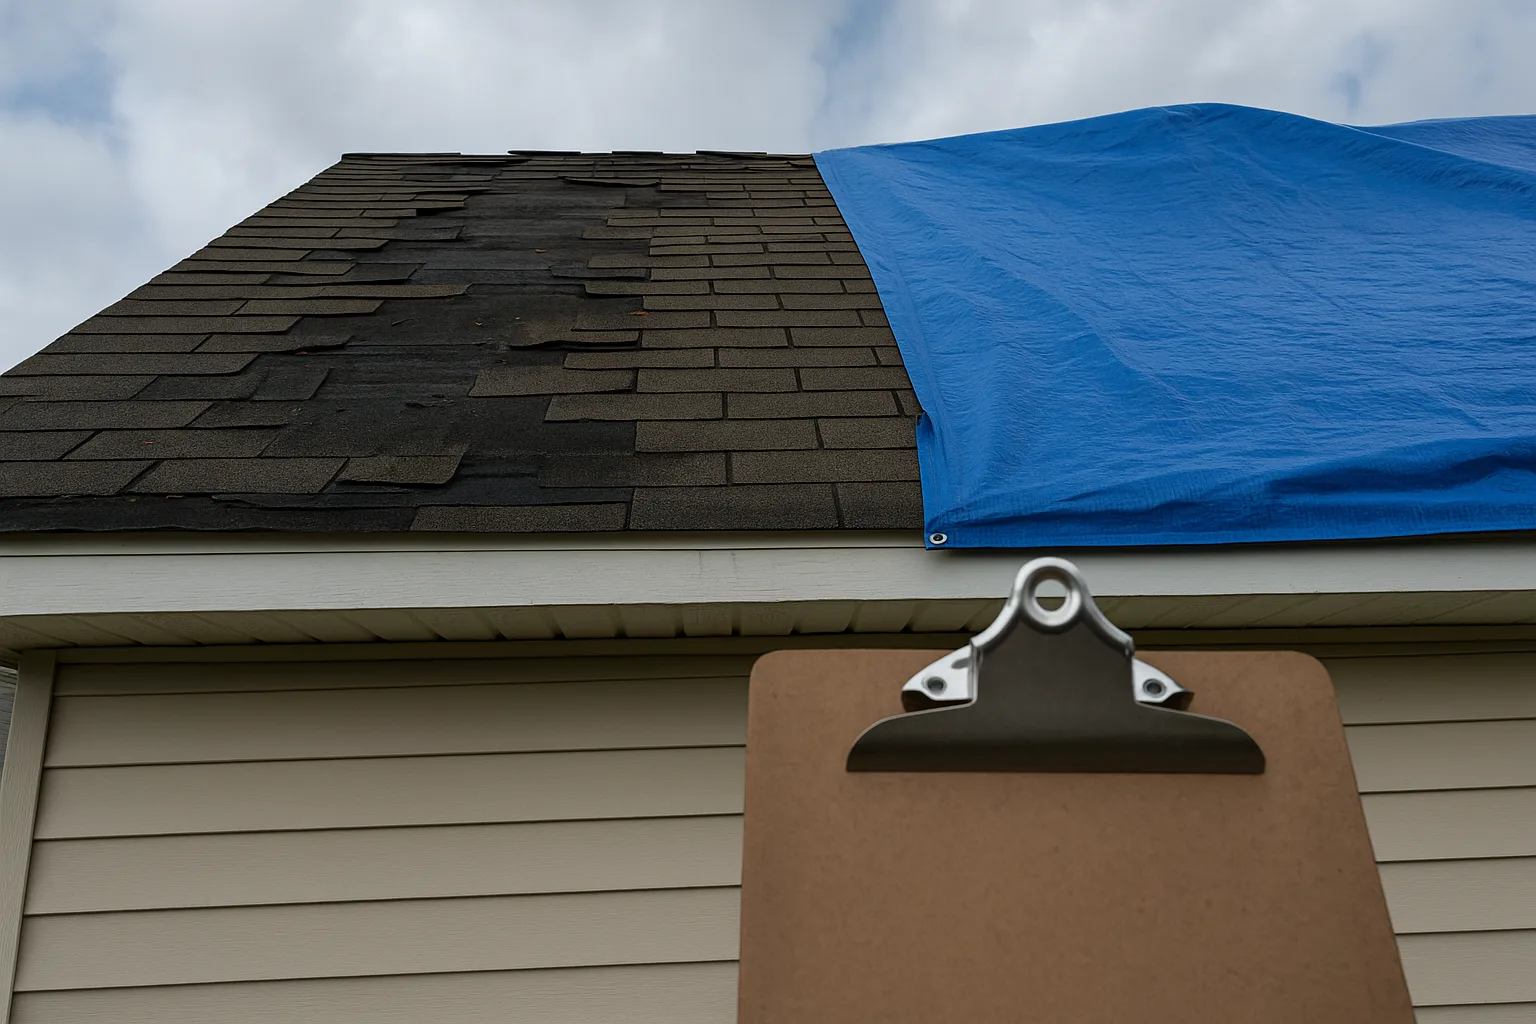
The $9,639 Lottery
The gap between the most and least expensive states for home insurance has hit $9,639 per year. That's not a typo. That's what separates a Florida homeowner from a Hawaii homeowner in 2026, according to MoneyGeek's April 2026 analysis of all 50 states. Nationally, the average annual premium sits at $3,548. Florida homeowners pay $10,240 — 189% above that average. Hawaii homeowners pay $601, 83% below it. You read that correctly: identical home coverage costs 17 times more depending on where you live.
Price-Quotes Research Lab examined the full 50-state terrain to understand not just where costs land, but why the divide keeps widening — and what homeowners in high-risk states can actually do about it.
National Average: $3,548 Per Year
The national average home insurance premium rose to $3,548 annually in 2026, a figure that obscures a brutal two-tier system. According to MoneyGeek's state-by-state analysis published April 9, 2026, 38 states have premiums below that average. Just 13 states exceed it. The expensive states aren't just slightly above average — they're blowing past it by margins that reshape what homeownership actually costs.
For context: a $3,548 annual premium translates to roughly $296 per month. That's manageable in isolation. But when you layer it onto a $350,000 mortgage at 7%, property taxes, and maintenance reserves, insurance becomes the line item that breaks the monthly budget in high-risk markets.
$9,639 separates the most expensive state (Florida) from the least expensive (Hawaii) — that's $803 per month, enough to fund an entire additional mortgage payment elsewhere.The 10 Most Expensive States: South and Great Plains Dominate
Every single one of the 10 most expensive states for home insurance in 2026 sits in either the South or the Great Plains. No exceptions. No Pacific Coast states in the top tier. No Northeast surprises. The clustering is a geographic fingerprint of hurricane exposure, tornado frequency, and severe convective storm patterns.
Florida sits in a category of one. The $10,240 annual premium is not just the highest — it's $1,743 above the next most expensive state. That gap alone exceeds the entire annual premium in 25 other states. The Sunshine State accounts for roughly $2 of every $10 in national catastrophe losses related to wind and storm damage, creating a risk concentration that private insurers have increasingly fled from.
Louisiana comes in second at $8,497 annually. The state absorbs multiple hurricane landfalls per decade, and post-Katrina market exits have left fewer private carriers competing for risk. Per PriceRamey's 2026 homeowners insurance analysis, Louisiana's market has structurally concentrated risk in fewer hands, allowing remaining carriers to price accordingly.
Oklahoma rounds out the top three at $7,683 annually. The state sits squarely in Tornado Alley, where violent tornado events have become more frequent in recent years, not less. A single EF4 tornado can total hundreds of homes in its path, and insurers price that accumulated exposure across every policyholder in the state.
Texas lands at $6,854 — fourth overall but potentially higher in coastal counties where hurricane exposure compounds with hail risk. The Texas insurance market has seen significant carrier consolidation, with several national carriers pulling back from coastal ZIP codes entirely.
Nebraska at $6,269 reflects its position in the central Plains tornado corridor. Spring and early summer supercell activity creates aggregate exposure that, while spread across fewer policyholders than Texas or Florida, still commands premium levels that surprise homeowners relocating from lower-risk regions.
The remaining top-10 states follow the same geographic logic: Kansas, Mississippi, Alabama, Missouri, and Arkansas — all states where wind damage from severe storms and tornadoes represents a structural, recurring cost of doing business in that part of the country.
Rank State Annual Premium Monthly Premium % Above National Avg 1 Florida $10,240 $853 +189% 2 Louisiana $8,497 $708 +140% 3 Oklahoma $7,683 $640 +117% 4 Texas $6,854 $571 +93% 5 Nebraska $6,269 $522 +77% 6 Kansas $6,100+ $508+ +72% 7 Mississippi $5,900+ $492+ +66% 8 Alabama $5,700+ $475+ +61% 9 Missouri $5,500+ $458+ +55% 10 Arkansas $5,300+ $442+ +49% The 10 Cheapest States: Hawaii, Vermont, and the Calm Corners
Flip the map and you find a completely different market reality. Insure.com's 2026 state rankings place Hawaii at the bottom of the cost spectrum — $601 annually, or roughly $50 per month. That figure is so low it barely registers as a budget line item for most households.
The cheapest states share geographic characteristics: either island-based (Hawaii), isolated from major storm corridors (Vermont at $960, Oregon at $1,023), or benefiting from mountains that deflect storm systems (Utah, Colorado). Washington State at $1,098 benefits from its maritime but temperate climate — rain damage is common but rarely catastrophic in the way that tornado or hurricane damage is.
Vermont's $960 annual premium is particularly striking given the state's northern latitude and harsh winters. The answer lies in risk frequency: a typical Vermont home faces snow load challenges and occasional flooding, but the probability of a single weather event destroying multiple homes in a 50-mile radius is dramatically lower than in Oklahoma or Louisiana. Insurers price that variance into the premium.
The Midwest and Pacific Northwest form the backbone of affordable insurance. Minnesota, Wisconsin, Michigan, and the Dakotas all sit below the national average despite cold-weather exposure, because winter damage tends to be isolated rather than widespread. A burst pipe destroys one home. A tornado destroys 200.
Why the Gap Keeps Widening: Climate, Carriers, and Consolidation
The 17x premium differential between Florida and Hawaii isn't arbitrary — it's actuarial. National Mortgage Professional's February 2026 analysis of the insurance market describes a structural shift where climate risk is fundamentally reshaping which states insurers want to cover.
The mechanism is straightforward: when carriers pay out massive catastrophe claims year after year, they either raise premiums, exit the market, or both. Florida has seen multiple large national carriers stop writing new policies in certain counties. Louisiana has lost at least three carriers to insolvency since 2020. Texas has seen geographic redlining where coastal ZIP codes are effectively served by only the state insurer of last resort.
This creates a feedback loop. When private carriers exit, state-created insurers of last resort absorb the risk. These insurers, often required by law to be available to all applicants, then operate at higher loss ratios, which gets passed back to policyholders through assessments and premium surcharges — sometimes even when you've never filed a claim yourself.
Reinsurance costs compound the problem. Reinsurers are the insurers of insurance companies — they spread carrier risk across the global market. When catastrophe losses mount globally, reinsurers raise their rates. Carriers then pass those costs to policyholders. Per PriceRamey's market analysis, this global cost pressure means even states with stable local risk profiles are seeing gradual premium increases as the overall system grows more expensive.
The 13 States Above National Average: A Closer Look
Beyond the top 10, three additional states warrant attention. Colorado has climbed into above-average territory due to wildfire exposure in the Front Range and Boulder County corridors. A single wildfire season can displace thousands of homes simultaneously — a concentration event that challenges even the most diversified insurer.
California sits just above the national average despite its wildfire crisis. This is counterintuitive until you consider that earthquake insurance, which California homeowners purchase separately, absorbs much of the wildfire-adjacent risk. California's high wildfire premiums are partially offset by the relative absence of hurricane and tornado exposure that drives Southern and Plains state costs.
New Jersey and New York both exceed the national average, driven by coastal exposure in both states. Nor'easter damage, storm surge from Atlantic storms, and the increasing frequency of high-wind events have elevated premiums in the Northeast corridor.
Historical Context: How We Got Here
The average home insurance premium has roughly doubled since 2015 in the most-affected states. Florida's trajectory is most dramatic: premiums have tripled in some counties as carriers repriced for a new reality of more-intense hurricane seasons, rising sea levels, and increased storm surge damage. Louisiana followed a similar pattern after the 2020 and 2021 hurricane seasons that produced back-to-back major landfalls.
The Great Plains states have seen a slower but steady climb. Tornado Alley hasn't shifted geographically, but the severity of individual tornado events has increased, with EF4 and EF5 tornadoes occurring in longer tracks than historically observed. Each new historical record for tornado damage creates pressure on carriers to reprice aggregate exposure.
What hasn't changed: the cheap states have largely stayed cheap. Hawaii's isolation from major continental weather systems, the Pacific Northwest's temperate climate, and the Mountain States' geographic protection from tropical moisture have kept those markets stable. A homeowner in Utah or Washington pays roughly what they paid five years ago, adjusted modestly for general inflation.
Consumer Impact: When Insurance Breaks the Deal
The real-world consequence of these premiums surfaces in housing markets. In coastal Florida, insurance now exceeds property taxes in many counties. For a home valued at $450,000, annual insurance at $10,240 represents $853 per month — in addition to mortgage, taxes, and HOA. This stacking effect has made otherwise-affordable homes financially inaccessible for first-time buyers who qualify for the mortgage but can't stomach the total monthly outlay.
Price-Quotes Research Lab has documented how insurance costs are reshaping migration patterns. Households relocating from high-premium states to lower-premium states report insurance savings as a primary motivator. A retiree leaving coastal Florida for central Tennessee can reduce their annual insurance bill by $7,000 or more — money that funds travel, healthcare, or leisure without touching investment returns.
For existing homeowners, premium spikes create a different problem: the inability to absorb sudden increases. When a carrier exits a state or county, policyholders get non-renewed and must find coverage in a harder market. The replacement carrier may charge 30% to 50% more for equivalent coverage, and that jump arrives without warning or negotiation.
What Homeowners Can Actually Do
The structural factors driving premium increases aren't controllable by individual policyholders. But pricing variation within states is significant. The difference between the highest and lowest quote for identical coverage can exceed $2,000 annually, even in high-cost states. Price-Quotes Research Lab's comparison tools capture this variation, showing that shopping isn't optional — it's how you avoid the penalty of carrier consolidation.
1. Compare at Least Four Carriers Annually
Carrier appetites shift constantly. A company that was expensive in your ZIP code last year may have repriced for growth this year. The only way to find out is to compare. Most homeowners with 10 years of tenure are paying significantly more than market because they auto-renewed through a single carrier.
2. Bundle Home and Auto
The discount typically runs 10% to 20% on the combined premium. On a $6,854 annual home insurance bill, that's $685 to $1,370 in savings. For high-premium states, bundling with the same carrier that covers your vehicle represents the single largest controllable variable in your insurance cost.
3. Raise Your Deductible Strategically
A $1,000 deductible versus a $500 deductible typically reduces premium by 5% to 10%. If you have emergency reserves to cover the higher deductible, the math works in your favor on an expected-value basis — you're self-insuring small claims in exchange for lower annual cost.
4. Invest in Wind Mitigation
In hurricane-prone states, wind mitigation features — hurricane straps, reinforced garage doors, impact-resistant windows — can reduce premiums by 15% to 30%. The ROI period varies, but for homeowners planning to stay five-plus years, the upfront cost of upgrades often pays for itself within two to three years in premium savings.
5. Ask About Paperless and Paid-in-Full Discounts
Carriers offer 3% to 5% discounts for paperless billing and annual prepay. These are small individually but cost nothing to claim. A $6,854 premium reduced by 8% saves $548 annually for the price of changing a billing setting.
6. Check Your Credit-Based Insurance Score
In most states, carriers use credit-based insurance scores as a rating factor. Improving your credit score by 50 points can meaningfully reduce your premium in states where this factor applies. This is a longer-term strategy, but for homeowners planning a multi-year tenure, it compounds.
The Regional Pattern Nobody's Talking About
Behind the state-level data sits a quieter trend: within expensive states, geographic selection is accelerating. Coastal Florida ZIP codes are served by fewer carriers than they were in 2018. Louisiana parishes that took storm damage in 2020 and 2021 have lost multiple market participants. This narrowing isn't uniform across the state — it's hyperlocal, targeting specific risk concentrations while leaving inland communities relatively stable.
The practical implication: a homeowner in Tampa Bay may face radically different insurance options than a homeowner 50 miles inland, even within the same county. Carriers are making granular bets on micro-geographies, and that granularity benefits informed shoppers who understand their specific risk profile.
The Bottom Line
Home insurance in 2026 is not a single national market. It's 50 state-level markets, each reflecting local risk profiles that have become more pronounced as climate patterns shift. Florida homeowners pay $10,240 because they live in the highest hurricane-risk corridor in the continental United States. Hawaii homeowners pay $601 because the nearest tropical storm is 2,500 miles away.
The gap isn't unfair — it's actuarial. But the gap is also exploitable by homeowners who shop strategically, bundle intelligently, and take steps to reduce their individual risk profile. The market punishes inertia. It rewards action.
Price-Quotes Research Lab's data shows that homeowners who compare at least four carriers when buying or renewing coverage save an average of $1,240 annually versus those who accept their current carrier's renewal offer. In high-premium states, that number climbs past $2,000. That's real money — money that either stays in your pocket or funds meaningful upgrades to your property's resilience.
The insurance market is becoming more volatile, not less. Carriers are exiting high-risk geographies, state pools are growing, and reinsurance costs are climbing. If you're in one of the 13 states above the national average, now is not the time for inertia. Now is the time to move.