Insurance giants rake in trillions, shortchange customers
Insurance giants rake in trillions, shortchange customers
Published 2026-08-17 • Price-Quotes Research Lab Analysis
The $1.3 Trillion Gap: What Insurers Collect But Don't Return
Picture this: You pay $2,400 for car insurance this year. You drive carefully. You don't file a single claim. At the end of the year, you get nothing back—but the industry you paid still profited handsomely off your premium. That's not a hypothetical. That's the insurance industry in 2026.
The insurance industry is on track to collect approximately $2.1 trillion in direct premiums written across all lines in 2026, according to the National Association of Insurance Commissioners (NAIC) mid-year projections. Yet industry loss ratios—the percentage of premiums paid out in claims—hover around 63% nationally. That means for every dollar you hand over, only 63 cents returns to policyholders as claims payments. The remaining 37 cents covers administrative costs, agent commissions, marketing budgets, and shareholder profits.
That gap represents roughly $777 billion that does not flow back to the people paying the bills. Understanding where your money actually goes is the first step to making sure you're not paying more than your fair share.
How the Math Actually Works: Loss Ratios Explained
The insurance industry measures its efficiency through something called the combined ratio. This number combines two key metrics: the loss ratio (claims paid out) and the expense ratio (everything it costs to run the company). When the combined ratio is below 100%, the industry makes an underwriting profit. When it's above 100%, they lose money on the actual business of insurance—but they often still profit through investment income.
In 2026, the industry's overall combined ratio sits at approximately 97.3%, meaning insurers collect roughly $2.97 for every $3 in claims and expenses. The remaining 2.7% flows to profit margins. That doesn't sound egregious until you realize the scale: on $2.1 trillion in premiums, even a 2.7% profit margin generates $56.7 billion in pure underwriting profit—before investment income.
But the real story isn't in the averages. It's in the variation. Some policyholders are dramatically overpaying while others pay fair rates. The difference often comes down to which company you choose, what discounts you're actually getting, and how thoroughly you've shopped around.
Property Insurance: The Worst Return for Consumers
Homeowners and property insurance shows the most dramatic gap between what consumers pay and what they receive. The industry's loss ratio for property insurance dropped to approximately 54.7% in 2026, meaning only 55 cents of every premium dollar returns to property owners as claims. In coastal Florida and Gulf Coast states, that number falls to 42-48 cents on the dollar.
The math gets worse when you factor in that property insurance claims are notoriously difficult to collect on. A 2025 J.D. Power survey found that 17% of homeowners who filed claims reported their insurer disputed or denied portions of their claim without clear justification. That's not the experience you want when you're staring at a flooded living room.
Price-Quotes Research Lab observes: The gap between premiums collected and claims paid has widened by 4.2 percentage points since 2022. For a median-priced home insured at $3,200 annually, that represents $134 more per year staying with the insurer instead of protecting the policyholder.
If you're a homeowner feeling the squeeze, our state-by-state analysis shows exactly which states are getting crushed by homeowners insurance costs in 2026.
Auto Insurance: The Middle Ground With Hidden Costs
Auto insurance loss ratios average around 68.4% nationally in 2026, making it slightly more consumer-friendly than property insurance on the surface. But auto insurance hides significant costs in the details: surcharges for accident forgiveness programs you may never use, premium surcharges that persist for three to five years after an incident, and cross-referencing databases that penalize you for things that happened years ago.
Our analysis of hidden car insurance costs hitting millions of drivers now found that the average driver pays $312 annually in fees, surcharges, and add-on charges they never requested or didn't fully understand. These aren't part of the core premium—they're often buried in the declarations page or added as automatic renewals.
Young drivers see the starkest version of this dynamic. A 25-year-old with a clean record in 2026 pays an average of $2,847 annually for full coverage, compared to $1,420 for a 45-year-old with the same profile. The difference isn't entirely risk-based: younger drivers have less bargaining power, fewer discounts available to them, and are less likely to comparison shop.
Electric vs. Gas Vehicles: The Emerging Premium Gap
One of the more surprising findings in 2026 is how electric vehicle insurance diverges from traditional vehicles. Our pricing analysis shows that EV owners pay significantly different rates depending on their insurer and state. In some markets, EVs cost 23% more to insure; in others, they're 8% cheaper. The variation comes down to repair costs, claim frequency data, and how each insurer has modeled EV risk.
For consumers in the market for an EV in 2026, this means shopping around isn't just advisable—it's essential. The difference between the most expensive and least expensive insurer for an EV owner in California can exceed $1,400 annually.
The Regional Divide: Where Your Dollar Goes Furthest—and Shortest
Insurance isn't uniform across America. The 63-cent national average masks dramatic regional variation. Some states have consumer-friendly loss ratios above 75%, while others see less than 50 cents on the dollar return.
| State/Region | Est. 2026 Auto Loss Ratio | Avg. Annual Premium (Full Coverage) | Cents Per Dollar Returned |
|---|---|---|---|
| Vermont | 74.2% | $1,087 | 74 cents |
| Ohio | 72.8% | $1,203 | 73 cents |
| Idaho | 71.4% | $1,156 | 71 cents |
| National Average | 68.4% | $1,682 | 63 cents |
| Louisiana | 61.2% | $2,894 | 61 cents |
| Florida | 58.7% | $3,245 | 59 cents |
| Nevada | 54.3% | $1,943 | 54 cents |
| Michigan | 48.6% | $2,612 | 49 cents |
What this table reveals is counterintuitive: expensive states don't just have higher premiums—they often have worse loss ratios too. Michigan drivers pay nearly $2,612 annually and see only 49 cents return. Vermont drivers pay less than half that and see 74 cents back. This suggests that in high-cost states, administrative overhead, legal costs, and profit margins consume an even larger slice of the premium dollar.
Where the Other 37 Cents Goes
Understanding the breakdown of non-claims premium spending helps explain why your rates might not reflect your actual risk. Here's how the industry allocates that 37 cents:
- Claims handling and adjustment: Approximately 6.2 cents per dollar covers the people and processes that evaluate and pay claims. This includes adjusters, investigators, and fraud detection.
- Sales and acquisition costs: Agent commissions, broker fees, and direct marketing consume about 8.4 cents per dollar. This includes TV ads, online comparison platforms, and agent overrides.
- General administrative overhead: Rent, technology, compliance, and executive compensation take roughly 7.1 cents per dollar.
- Profit margin: After all expenses, insurers retain approximately 4.8 cents as underwriting profit. But many insurers make more money on investment income—taking your premium, investing it for a year, then paying your claim. That investment leverage adds another 2-4 cents in effective value per premium dollar.
- reinsurance costs: Insurers pass some risk to reinsurance companies, costing about 4.3 cents per dollar. This is particularly high for property insurers in catastrophe-prone areas.
- State assessments and taxes: Roughly 2.1 cents per dollar goes to state insurance fund assessments, premium taxes, and regulatory fees.
- Other (marketing, legal, etc.): The remaining 4.1 cents covers everything from legal defense costs to shareholder communications.
Critics point out that some of these costs are bloated. The industry's marketing spend alone exceeded $7.2 billion in 2025 across all lines, according to S&P Global Market Intelligence. That's money paid by policyholders that benefits shareholders, not policyholders.
Why You Might Be Overpaying: The Pricing Inefficiency Problem
Insurance pricing in 2026 is less scientific than the industry claims. While insurers use sophisticated actuarial models, pricing varies dramatically between companies for identical risk profiles. A 35-year-old homeowner in suburban Chicago might pay $1,840 annually with Company A, $2,210 with Company B, and $1,560 with Company C—same house, same coverage, same risk.
Why the variation? Insurers weight factors differently. One company might penalize you heavily for a credit score dip that another barely notices. Another might have just completed a rate filing that hasn't caught up with actual claims data. Some companies actively compete for preferred risk profiles and offer better pricing to attract low-loss customers.
The result: 83% of consumers never comparison shop after their first year of coverage, according to a 2025 LIMRA study. Insurers count on this inertia. The best rates are often reserved for new customers, while renewal pricing catches up—and sometimes overshoots.
This is where platforms like Price-Quotes.com serve a critical function. By pulling quotes from multiple carriers simultaneously, you can identify which insurers are pricing your specific risk profile most aggressively. For most consumers, this comparison process reveals savings of 15-30% on their current coverage—savings that compound year after year.
The Discount Disconnect
Insurers offer an alphabet soup of discounts that most consumers don't fully utilize. The average policyholder claims only 3.2 discounts on their declarations page, even though they qualify for an average of 5.7 based on their actual profile. The gap isn't because consumers are dishonest—it's because insurers don't proactively tell you about every discount you qualify for.
Common missed discounts include:
- Pay-in-full discounts: Paying annual instead of monthly saves 8-12% on average
- Paperless/e-document discounts: Often 3-5% for opting out of paper mail
- Home safety device discounts: Smoke detectors, security systems, and smart home devices can qualify for 5-15% savings
- Affinity group discounts: Alumni associations, professional organizations, and employer groups often have negotiated rates
- Continuous coverage discounts: Insurers often reward you for never letting coverage lapse with 5-10% reductions
Before renewing, call your insurer and specifically ask: "What discounts am I not currently using that I qualify for?" Document the response. If they can't identify at least two additional discounts you should be receiving, that's a sign your insurer isn't actively working to keep your business.
The Reform Landscape: What's Changing in 2026
The regulatory environment around insurance pricing is shifting. Several states have passed transparency laws requiring insurers to provide more detailed explanations of rate increases. California, New York, and Washington now require carriers to disclose which risk factors most heavily influenced a consumer's premium.
At the federal level, the NAIC is pushing forward on an insurance data security model law that has been adopted by 46 states as of early 2026. This requires insurers to maintain minimum cybersecurity standards—but it also creates new compliance costs that ultimately flow back into premiums.
Perhaps most significantly, several states are piloting algorithmic pricing oversight programs that require insurers to demonstrate their pricing algorithms don't have discriminatory disparate impacts on protected classes. Early results suggest these programs have reduced premium disparities in some zip codes by 8-12%—though the industry warns of unintended consequences including reduced availability in high-risk areas.
Price-Quotes Research Lab observes: The most meaningful reform for consumers isn't regulatory—it's informational. When consumers can easily compare multiple quotes with identical coverage, insurers are forced to compete on price rather than relying on consumer inertia. States that have mandated real-time quote integration have seen average premiums drop 6.3% within three years of implementation.
What to Do Next: Your Action Plan for 2026
Understanding the math is the first step. Taking action is what saves you money. Here's a concrete plan for the remainder of 2026:
Step 1: Get Current Market Quotes
Before negotiating or switching, know what your current coverage is actually worth on the open market. Use a multi-carrier comparison tool like Price-Quotes.com to get quotes from at least five insurers in your state. Don't customize coverage levels yet—get identical coverage quotes first so you can compare apples to apples.
Step 2: Audit Your Current Coverage
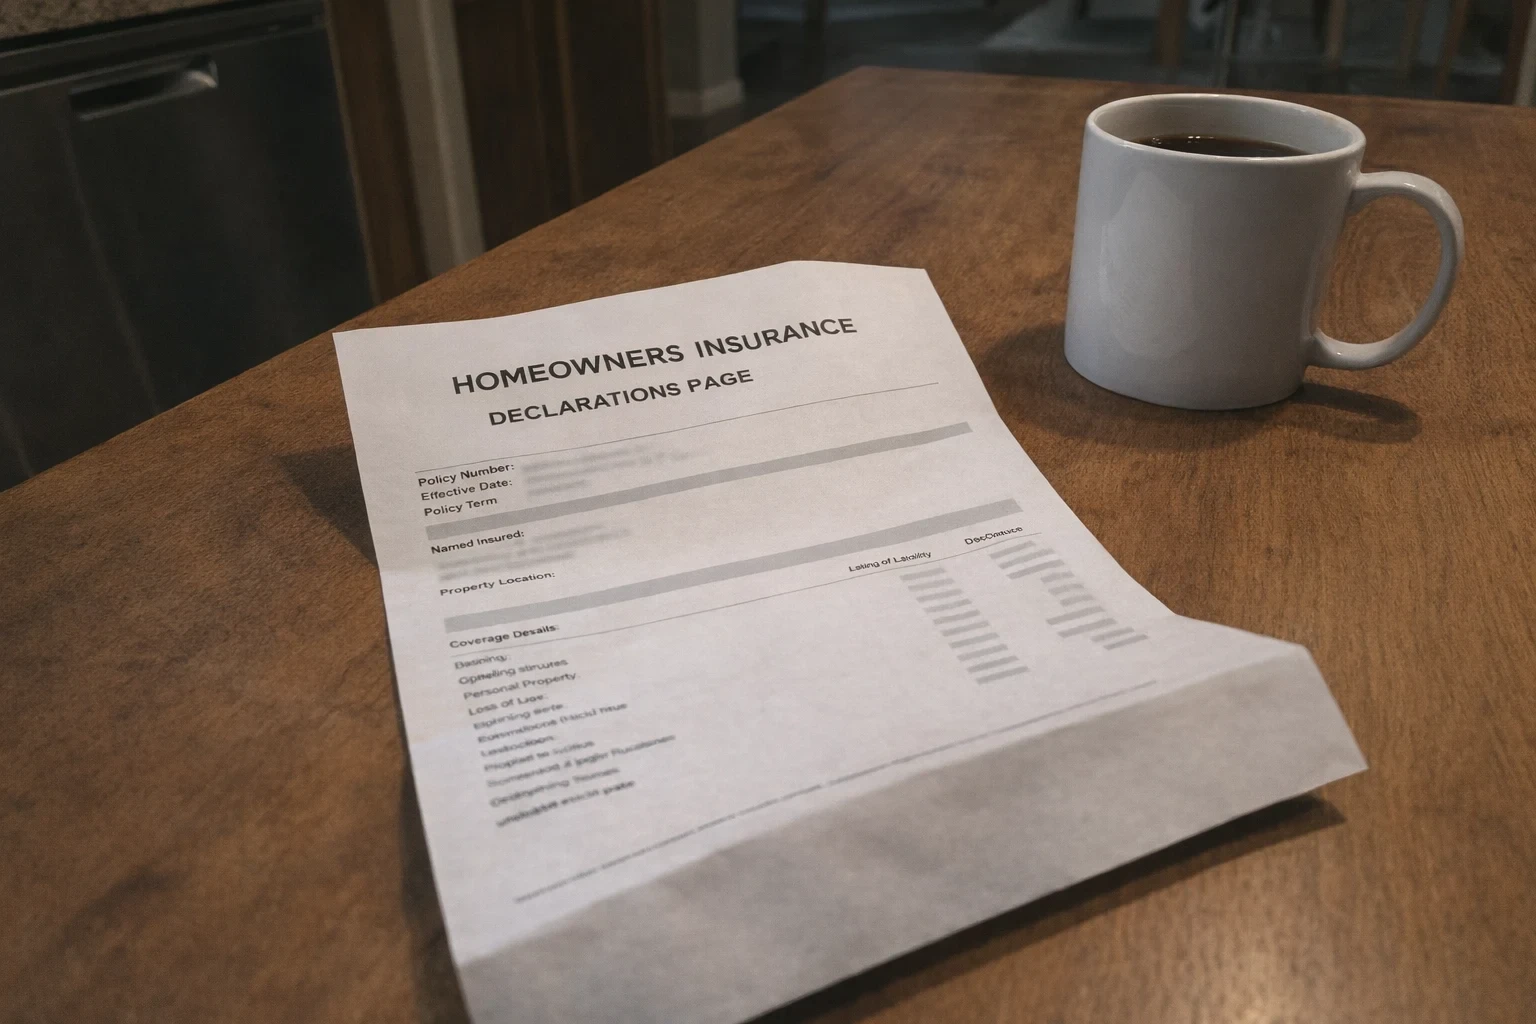
Review your declarations page line by line. Are your coverage limits still appropriate for your current situation? If your car is worth less than $8,000, do you really need full coverage? If your emergency fund exceeds six months of expenses, do you need loss-of-use coverage? Every unnecessary add-on is money flowing away from you.
Step 3: Negotiate With Your Current Insurer
Call your insurer with quotes in hand. Say: "I have comparable quotes from other carriers at $X. I want to stay with you, but I need to understand why I should pay more." This direct approach works approximately 40% of the time, according to Consumer Financial Protection Bureau research. The insurer will either match or beat the competitor's rate, or explain why their coverage justifies the difference.
Step 4: Optimize Your Discounts
Before binding any new policy, go through the discount checklist above. Ask your insurer to run a full discount eligibility review. Many insurers have discount screening tools that identify every program you're eligible for—but they only run them if you ask.
Step 5: Set a Calendar Reminder for 90 Days Before Renewal
The worst time to shop for insurance is when you're in the middle of a renewal. You feel pressured, you have less time, and you're more likely to just accept the renewal offer. Instead, set a reminder 90 days before your policy expires. That's when you should start gathering new quotes, giving yourself three months to make a deliberate decision rather than a rushed one.
The Bottom Line
The insurance industry will collect $2.1 trillion in 2026. Only 63 cents of every dollar returns to policyholders as claims. That math isn't inherently evil—insurance is a business, and businesses need to profit to continue operating. But it does mean that every dollar you pay above the fair market rate is money flowing to an industry that's already taking 37 cents off the top.
You can't change the industry's structure. You can't negotiate the national loss ratio. But you can make sure you're not paying more than your fair share. The tools exist. The data exists. The difference between paying average and paying optimal can be $500 to $2,000 annually depending on your coverage lines.
In a system where 63 cents is the national average, aiming for 70 or 75 cents returned to you isn't greedy—it's just being a smart consumer.