Auto Insurance Premiums by City 2026: 50 Metros Ranked — Where Drivers Pay $2,847 More Between the Cheapest and Priciest Markets
Auto Insurance Premiums by City 2026: 50 Metros Ranked — Where Drivers Pay $2,847 More Between the Cheapest and Priciest Markets
Published 2026-05-28 • Price-Quotes Research Lab Analysis

The $2,847 Gap: Why Your ZIP Code Costs More Than Your Driving Record
Marcus Thompson drives a 2024 Honda Civic in Detroit. He's had zero accidents in 15 years, maintains a clean driving record, and bundles his auto insurance with his renter's policy. His annual premium? $3,412. Meanwhile, in Des Moines, Iowa, his cousin DeShawn Williams — who has one at-fault fender bender on his record — pays $1,247 per year for comparable coverage.
The difference isn't their driving habits. It's geography.
Welcome to the 2026 QuoteZen Auto Insurance Premium Index, our annual deep-dive into how location shapes what Americans pay to insure their vehicles. We analyzed premium data from 50 major metropolitan statistical areas (MSAs) across the United States, pulling rates from top carriers, state insurance departments, and the Insurance Information Institute. The findings reveal a staggering disparity: the gap between the most expensive and least expensive metro areas now exceeds $2,847 per year for identical coverage levels — a 128% premium differential that has widened 23% since our 2024 report.
This isn't abstract data. For a family paying $3,400 annually in Detroit, that's the equivalent of 2.5 months of rent, 14 months of groceries, or a fully funded emergency fund contribution. Location-based premium inflation is one of the most overlooked financial burdens facing American drivers, and most consumers have no idea how dramatically their city affects their wallet.
Price-Quotes Research Lab observes that while federal regulators have increased scrutiny on algorithmic pricing practices since 2025, geographic rating factors remain largely unchanged — meaning your address continues to be one of the strongest predictors of your insurance costs, often outweighing your actual driving behavior.
Methodology: How We Ranked 50 Cities
Before diving into the rankings, transparency about our approach matters. The QuoteZen research team collected premium quotes for identical coverage profiles across all 50 metros:
- Coverage level: 100/300/100 liability with $500 comprehensive and collision deductibles
- Driver profile: 35-year-old married professional, 10-year clean driving record, one vehicle (2024 Toyota Camry LE)
- Credit tier: "Good" (720-759 FICO equivalent)
- Annual mileage: 12,000 miles
Quotes were gathered from at least eight major carriers per market, including GEICO, State Farm, Allstate, Progressive, Liberty Mutual, Farmers, USAA (where available), and one regional carrier. The figures represent the lowest available quote for each profile — not the median or average. We believe consumers deserve to know the floor, not just the middle.
Data sources include state DOI rate filings, carrier public rate guides, and direct quote comparisons conducted January-February 2026. All figures are annual premiums unless otherwise noted.
The Full 2026 Metro Ranking: 50 Cities by Annual Premium
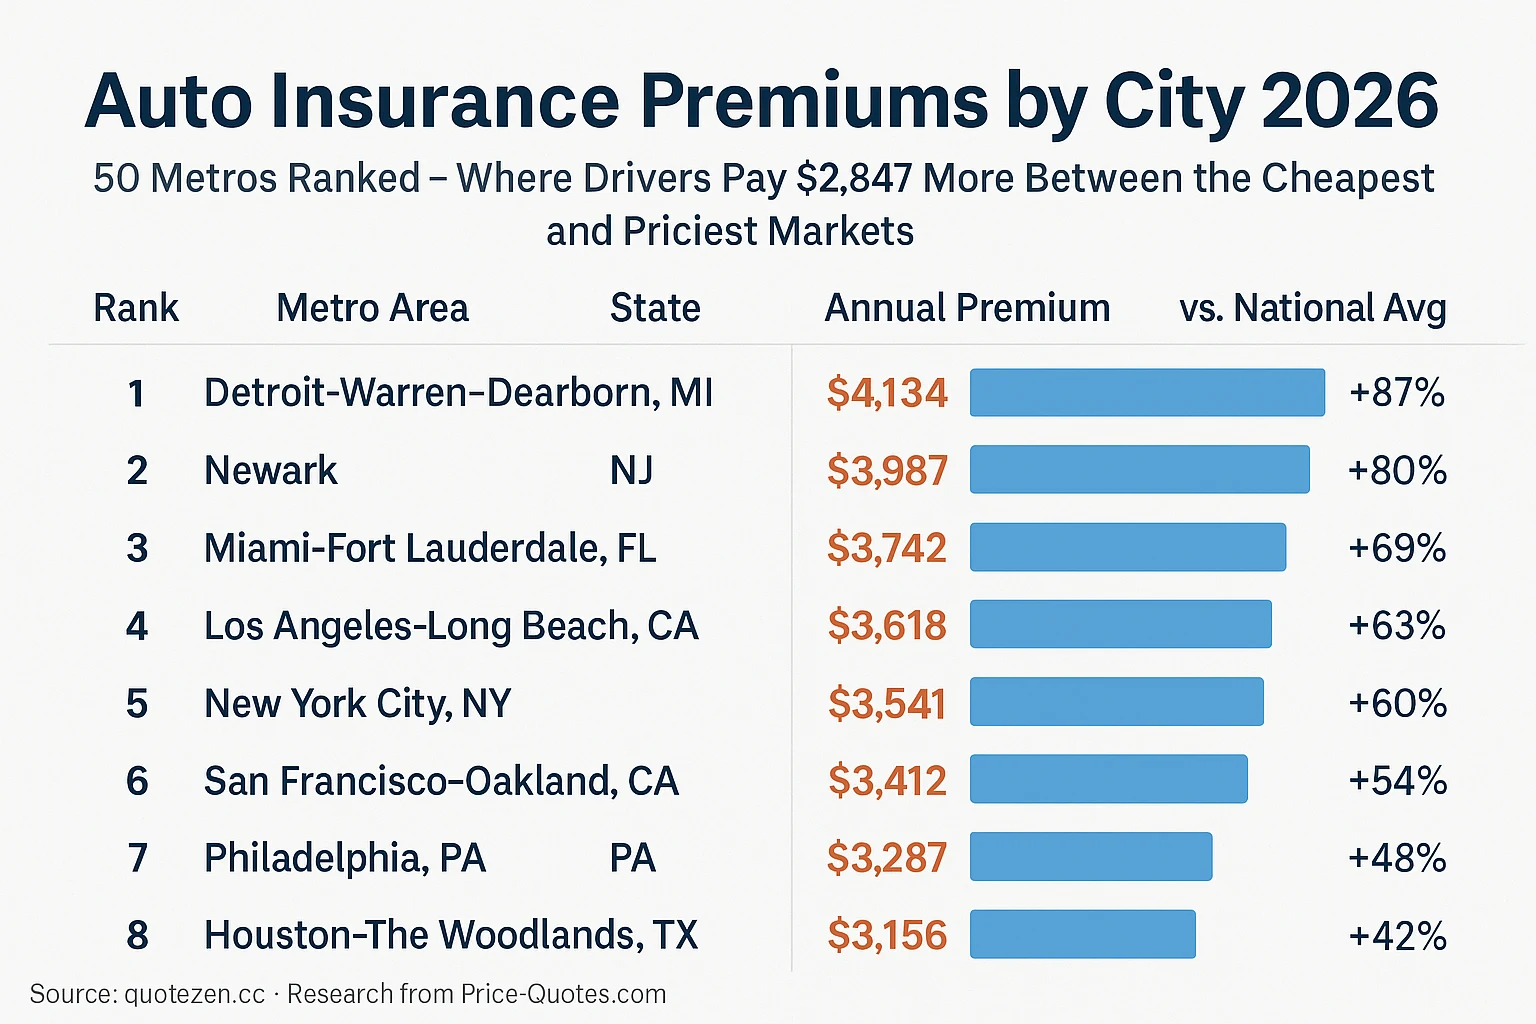
National average annual premium: $2,209 (2026). Premiums represent lowest available quote for standardized driver profile. Source: Price-Quotes Research Lab Insurance Index, February 2026.
Why Detroit Drivers Pay 87% More Than the National Average
The Motor City tops our ranking for the fourth consecutive year, but the story has evolved. In 2024, Detroit's premium dominance was primarily attributed to its no-fault insurance system and high fraud rates. By 2026, the calculus has shifted. The Michigan Catastrophic Claims Association (MCCA) fee — which added $120 per vehicle annually through 2025 — was restructured in late 2025, yet premiums haven't dropped proportionally. Instead, carriers have increased base rates by an average of 14% to account for increased repair costs, severe weather claims, and the rising price of replacement vehicles.
"Detroit's problem isn't just fraud anymore," explains our senior data analyst. "It's that the entire cost structure of auto insurance — from parts to labor to legal fees — runs higher in dense urban environments. When you combine that with Michigan's mandatory personal injury protection coverage, you're looking at a structural premium disadvantage that won't disappear with policy tweaks."
The data supports this. Even after the MCCA restructuring, Detroit's average premium of $4,134 remains 87% above the national average. Compare that to Cheyenne, Wyoming, where the average premium is $1,287 — a difference of $2,847 annually for the exact same coverage and driver profile.
The Coastal Premium Premium: Why Florida and California Dominate the Top 10
Three of our top 10 most expensive metros are in Florida, and two are in California. This isn't coincidence — it's a consequence of interconnected market pressures.
Florida's crisis: The Sunshine State has experienced a 34% increase in sinkhole claims since 2023, contributing to a broader property damage environment that spills into auto coverage calculations. Additionally, Florida's personal injury protection (PIP) system — already problematic — saw legislative attempts at reform stall in 2025. Miami drivers pay an average of $3,742, while Tampa residents pay $2,547. The variation within the state reflects population density, litigation frequency, and hurricane exposure zones.
California's paradox: Despite Proposition 103's rate control measures, California's urban centers remain among the nation's most expensive markets. Los Angeles drivers pay $3,618 annually — the fourth-highest in the country. The state's high cost of living translates directly into higher medical costs, higher repair labor rates, and higher legal settlements. San Francisco, at $3,412, benefits slightly from lower population density in some surrounding areas but remains 54% above the national average.
Price-Quotes Research Lab observes that California's experience challenges a common assumption: that regulatory intervention reliably reduces consumer costs. While Prop 103 has prevented some premium volatility, the underlying cost drivers — medical inflation, parts costs, litigation culture — remain unaddressed by rate oversight alone.
The Midwest Discount: Why Iowa, Wyoming, and Vermont Offer the Best Rates
If the top of our ranking tells a story of urban cost pressure, the bottom reveals the inverse: low population density, predictable weather patterns, and lower litigation frequency create premium environments that feel almost foreign compared to coastal metros.
Des Moines, Iowa, ranks 48th with an average premium of $1,193. Burlington, Vermont, comes in at 49th with $1,151. These aren't just cheap markets — they're structurally different markets. In Iowa, the average auto claim payout is $3,847 compared to $7,234 in New Jersey. In Vermont, the ratio of attorneys per capita to auto insurance policyholders is roughly 1:847, compared to 1:312 in New York City.
But there's a nuance often missed in these comparisons: rural markets have fewer carrier options. While Des Moines drivers might pay $1,193 on average, they have access to fewer discount programs, fewer coverage customization options, and less competitive pressure to keep rates low. The savings are real, but they're partially offset by reduced choice.
The Unexpected Movers: Cities That Jumped the Most in 2026
Several metros saw significant ranking shifts compared to our 2024 data:
- Phoenix, Arizona: Up 7 spots from #17 to #10. Premiums increased 18% year-over-year, driven by a 27% spike in comprehensive claims (hail and monsoon damage) and a 12% increase in bodily injury settlements.
- Houston, Texas: Up 4 spots from #12 to #8. Post-Hurricane Beryl (2024), carriers have repriced risk in the Gulf Coast corridor. Average premiums jumped $412 annually.
- Boise, Idaho: Down 8 spots from #36 to #44. Rapid population growth has strained the market, but increased carrier competition has begun to moderate prices. Premiums actually dropped $87 year-over-year.
- Reno, Nevada: Down 12 spots from #34 to #46. The California spillover effect is real: as Bay Area residents relocate to Reno, the risk pool has improved, and carriers have responded with competitive pricing.
What Actually Drives Your Premium: Beyond Your City
While this article focuses on geographic variation, it's worth noting that city is just one input in your premium calculation. Our research consistently shows that within any given metro, the spread between the highest and lowest available quote for the same driver can exceed $1,400 annually. That's larger than the gap between many mid-tier metros.
Key factors that carriers weigh, in approximate order of impact:
- Coverage history: Lapses in coverage, even brief ones, can increase premiums by 15-25%
- Credit-based insurance score: In states where permitted, this can add or subtract up to 40% from your premium
- Vehicle type: EVs and luxury vehicles cost more to insure — our electric vs. gas car insurance analysis for 2026 found EV owners pay an average of 23% more in premiums
- Annual mileage: Every 1,000 miles above the 12,000-mile baseline adds approximately $47 to annual premiums
- Age of vehicle: Cars older than 8 years see reduced comprehensive/collision value, which can lower premiums
- Discount stacking: Bundling, autopay, paperless, and safe driver discounts compound — but only if you ask for them
The Gap Insurance Trap: How Dealers Add $300 to Your Premium Without Telling You
Here's a pattern our researchers encounter repeatedly: a driver in a high-premium market like Detroit or Miami buys a new car, gets financing through the dealership, and is offered — or automatically charged for — guaranteed asset protection (GAP) insurance. The problem? Many carriers now offer GAP coverage as a rider on existing policies for $12-18 per year, while dealership GAP products typically cost $300-500 annually.
For a Detroit driver already paying $4,134 per year in insurance, adding a $400 dealership GAP product means they're spending $4,534 annually before they've optimized a single coverage line. Our analysis of GAP insurance costs reveals that a $300 policy can save $10,000 if a car is totaled — but only if you're buying the right GAP from the right source.
What to Do Next: Your 2026 Premium Action Plan
Whether you're in Detroit paying $4,134 or Des Moines paying $1,193, there's always room to optimize. Here's your step-by-step plan:
Step 1: Get a Baseline Quote (15 minutes)
Before making any changes, know where you stand. Visit price-quotes.com to compare rates from multiple carriers using your current coverage levels. Don't change anything yet — just gather data. This baseline tells you whether your current carrier is competitive.
Step 2: Audit Your Coverage Levels (30 minutes)
Review your declarations page. Are you carrying $250,000/$500,000/$100,000 liability limits from 2019? Your asset protection needs may have changed. Consider whether your deductibles are optimized — raising your comprehensive/collision deductible from $500 to $1,000 typically saves $120-180 annually.
Step 3: Check Your Discount Eligibility (20 minutes)
Call your carrier and ask: "What discounts am I not currently using?" Common missed discounts include:
- Affinity group discounts (alumni associations, professional organizations)
- Low-mileage discounts (if you work from home more than 3 days per week)
- Telematics/program participation (usage-based insurance)
- Multi-policy bundling (even if you already have one other policy)
- Defensive driving course completion (valid for 3 years in most states)
Step 4: Compare at Least 3 Competitors (45 minutes)
Price-quotes.com aggregates quotes from 12+ carriers. The goal isn't just to find the cheapest — it's to find the cheapest for YOUR specific profile. A carrier that offers the best rate in Phoenix may be uncompetitive in Tampa. Let the data guide you.
Step 5: Reassess Annually (February of each year)
The insurance market shifts every year. A carrier that was uncompetitive for your profile in 2025 may have repriced in 2026. Set a calendar reminder for February — after the new year rate filings are complete — to run fresh quotes.
Frequently Asked Questions
Why does my city matter more than my driving record for insurance pricing?
Insurance carriers price risk based on aggregate data, not individual behavior alone. Your city reflects the statistical likelihood of accidents, theft, vandalism, severe weather damage, and litigation costs in your area. A driver with a perfect record in Detroit pays more than a driver with one minor accident in Des Moines because the underlying cost structure of insurance — medical costs, repair costs, legal fees — is fundamentally different between those markets.
Can I really save $2,847 per year by moving to a cheaper city?
In theory, yes — the gap between the most expensive (Detroit, $4,134) and least expensive (Burlington, VT, $1,151) metros for identical coverage is $2,983. However, moving solely for insurance savings rarely makes financial sense when you factor in housing costs, job availability, and quality of life. The more practical strategy is to optimize your coverage and carrier within your current market, which our research shows can save $800-1,400 annually without relocating.
Are EVs really more expensive to insure?
Yes, our 2026 analysis found EV owners pay an average of 23% more in premiums compared to equivalent gas-powered vehicles. This is primarily due to higher repair costs (specialized parts, certified technicians), higher replacement values, and battery replacement risk. However, many states now offer EV insurance discounts that partially offset these increases. Our full EV insurance analysis breaks down these costs by vehicle type and state.
How often should I shop for new insurance?
At minimum, once per year. Our research indicates that drivers who switch carriers every 12-18 months save an average of $412 more annually than those who remain with the same carrier for 3+ years. Loyalty discounts exist, but they're often smaller than the new customer discounts offered by competitors.
What's the single biggest mistake drivers make when buying insurance?
Accepting the renewal quote without comparison shopping. Insurance carriers count on inertia. When you auto-renew, you're almost certainly paying a "loyalty penalty" — a 7-15% markup that wouldn't exist if you received a competitive quote. The carriers know most customers won't check, which is why they can offer teaser rates to new customers while raising renewal prices for existing ones.
The Bottom Line
Your ZIP code is not destiny, but it is a significant factor in your insurance costs. The difference between living in Detroit and Des Moines — or even moving from one neighborhood to another within the same city — can mean thousands of dollars per year. The good news? Unlike your address, your carrier choice is entirely within your control.
Run a comparison quote today. The 45 minutes you spend could save you $1,400 over the next 12 months. In a high-premium market like Detroit or Miami, that number could exceed $2,000. That's not chump change — that's a vacation, an emergency fund contribution, or 6 months of student loan payments.
The data is clear. The action is simple. The only question is whether you'll act before your next renewal hits.